When planning market research with global trade records, examine the definitions behind the numbers before interpreting the trend. Product scope, reporter and partner roles, period, valuation, coverage, classification, and revision status determine what a comparison actually means.
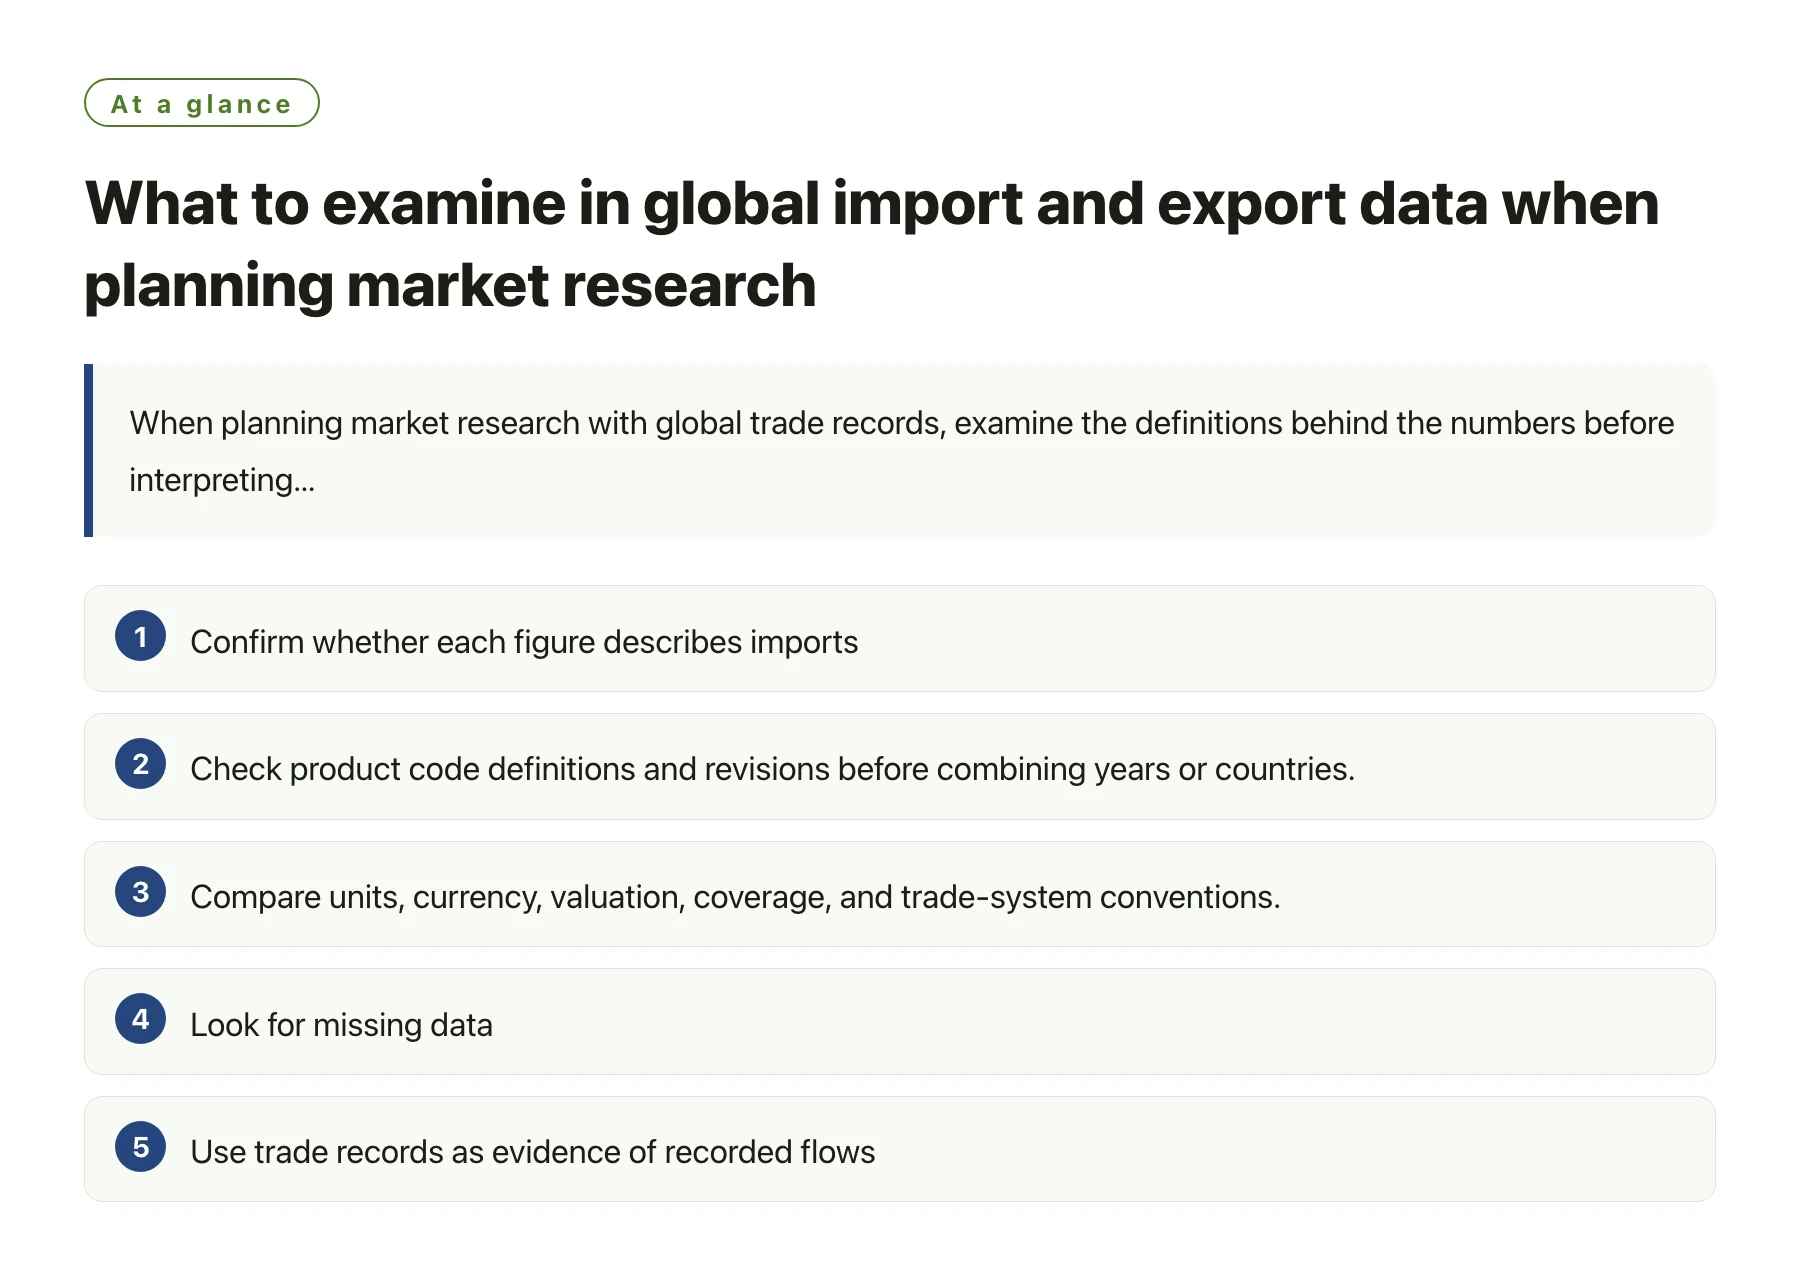
Key takeawaysConfirm whether each figure describes imports, exports, or re-exports and identify who reported it. · Check product code definitions and revisions before combining years or countries. · Compare units, currency, valuation, coverage, and trade-system conventions. · Look for missing data, reporting breaks, revisions, and suppressed observations. [1] · Use trade records as evidence of recorded flows, then seek separate evidence for customer demand and commercial fit.
A trade-data search can return a neat table with country names, product codes, dates, quantities, and values. The clean appearance can hide differences in how each cell was compiled. A research team that skips the metadata stage may compare unlike measures, mistake missing information for no activity, or treat a reported movement as a direct measure of demand.
The following checklist helps analysts decide whether a dataset is fit for a particular question. It is useful for market-entry screens, sourcing studies, competitor reviews, and research briefs that combine national trade statistics with more detailed company records.
1. Identify the reporter and flow direction
Every observation should have a reporting economy and a direction. An import reported by the destination country is not necessarily identical to an export reported by the origin country. The records may use different dates, values, partner attribution rules, or coverage. A bilateral discrepancy is therefore a question to investigate, rather than immediate proof that one side is wrong.
Write the roles in plain language in your working notes: “imports reported by destination A from partner B” is clearer than “A–B trade.” Keep exports, imports, and re-exports separate where the source provides those distinctions. If the source aggregates re-exports into exports, note the convention before using the series to judge domestic production or supplier origin.
Also ask whether the dataset describes a customs movement, a statistical estimate, or a national accounts measure. These concepts are related but not interchangeable. The WTO’s technical notes describe differences between general and special trade systems and explain that official merchandise statistics based on customs records may differ from balance-of-payments treatments. [1]
2. Test the product definition
Product matching is often the largest hidden judgment in a market screen. A commercial product name may include several materials, grades, or end uses, while the trade classification splits or combines them differently. Record the code, official description, code system, revision, and any explanatory notes. If you search alternative terms, preserve the mapping so another researcher can tell what was included.
Check whether the level of detail is comparable across the selected geographies. One country may publish a national tariff line with more digits than the international classification level. Those extra digits can identify local statistical categories, but they may not have equivalents elsewhere. For cross-country comparison, decide whether to aggregate to a common level or use separate country-specific views.
Build a small sensitivity check when classification choices could change the result. Compare a narrow definition with a defensible broader definition, and explain why each is useful. Do not add codes that only loosely resemble the product. A larger total is not more accurate merely because it covers more rows.
3. Read units, valuation, and time together
A value series and a quantity series tell different stories. Confirm the currency, scale, weight or supplementary unit, and valuation basis. A value increase can arise from a price shift, exchange-rate movement, a mix of different products, or a physical volume change. If the quantity unit changes across rows, do not calculate growth until the values are converted to a common basis.
Choose a time window that fits the decision. Annual observations can smooth some monthly variability but may conceal seasonality. Monthly series are more timely but can be more volatile and subject to revision. Record the release or retrieval date; current databases may revise historical data after an earlier report was produced.
When calculating growth, state the start and end periods and the formula. Be cautious with percentage rates when the starting value is very small or zero. In those situations, absolute differences or an indexed series may communicate the change more honestly than a large percentage that is difficult to interpret.
4. Use a compact comparability checklist
| Field to check | Question for the analyst | Why it matters |
|---|---|---|
| Coverage | Are free zones, processing trade, and warehouse movements included? | Coverage differences can change totals. |
| Trade system | Is the series based on general or special trade? | Some flows may be included in one system and not another. |
| Valuation | Are imports and exports valued on the same basis? | Different border valuation points affect bilateral comparisons. |
| Classification | Did the code description or revision change? | A break may reflect a reclassification rather than a market shift. |
| Missingness | Are blanks, suppressed rows, and zero values distinguished? | Missing or protected data should not be read as no trade. |
| Revision | Has the source corrected or revised the period? | A saved extract may differ from the current series. |
The checklist should be completed for each source before combining observations, not just once for the entire project. For a concrete example of source-specific dimensions, the U.S. Census Bureau organizes international trade data by classification systems, trading partners, states, and other geography; the selected table and its metadata should be saved with the analysis. [2]
5. Distinguish market signals from company evidence
Aggregate statistics can help select markets for deeper review. They do not show by themselves that an individual company is accessible, financially sound, or interested in a new supplier. If the next stage involves named buyers or suppliers, treat company-level records as a discovery layer and confirm identity through separate sources such as corporate pages, filings, directories, or direct contact.
If shipment descriptions are broad, retain the original text and avoid over-precision in your conclusion. A company may appear under multiple spellings or entities, and a matching name can belong to a different organization. Verify the legal identity, geography, activity date, and product relevance before treating the record as a prospect.
For researchers who need a searchable view across records and company information, import and export data may be one tool to evaluate. Before choosing it or any alternative, inspect sample results for the exact countries and product terms in scope, and check the platform’s update cadence, data fields, coverage notes, and permitted use.
6. Make limitations visible in the final brief
A strong research note distinguishes observed data from an explanation. “Recorded imports changed between these periods” is a statement about a series. “Demand is increasing” is a broader conclusion that needs additional evidence. The second statement may be reasonable, but it should be supported with information beyond a single trade table, such as customer research, pricing, regulations, distribution, or other market indicators.
List the limitations that could change the recommendation: inconsistent reporter practices, missing observations, broad product codes, lagged releases, revisions, re-exports, and uncertainty in company matching. If a discrepancy remains unresolved, report it rather than forcing a single number. A range or qualified conclusion can be more useful than false precision.
Finally, preserve the query, source, filters, date, code mapping, and transformations. A reproducible trail makes the result easier to update and easier for colleagues to challenge. The goal is not to eliminate uncertainty; it is to make the uncertainty legible enough that a business decision can account for it.
Sources
Frequently asked questions
Why do partner-reported imports and exports not always match?
Reporting periods, valuation, coverage, partner attribution, trade systems, revisions, and re-exports can differ between the two records.
Can missing trade data be treated as zero?
No. A blank, suppressed, unavailable, or unreported observation is different from a recorded zero and should be labeled separately.
When should researchers use monthly instead of annual trade data?
Use monthly series when timing or seasonality matters and the source supports a reliable comparison; use annual series when a broader view is more appropriate. Always note revisions and the retrieval date.
Do aggregate trade flows prove a company is a qualified lead?
No. They can guide follow-up research, but identity, current activity, purchasing intent, and fit require independent confirmation.